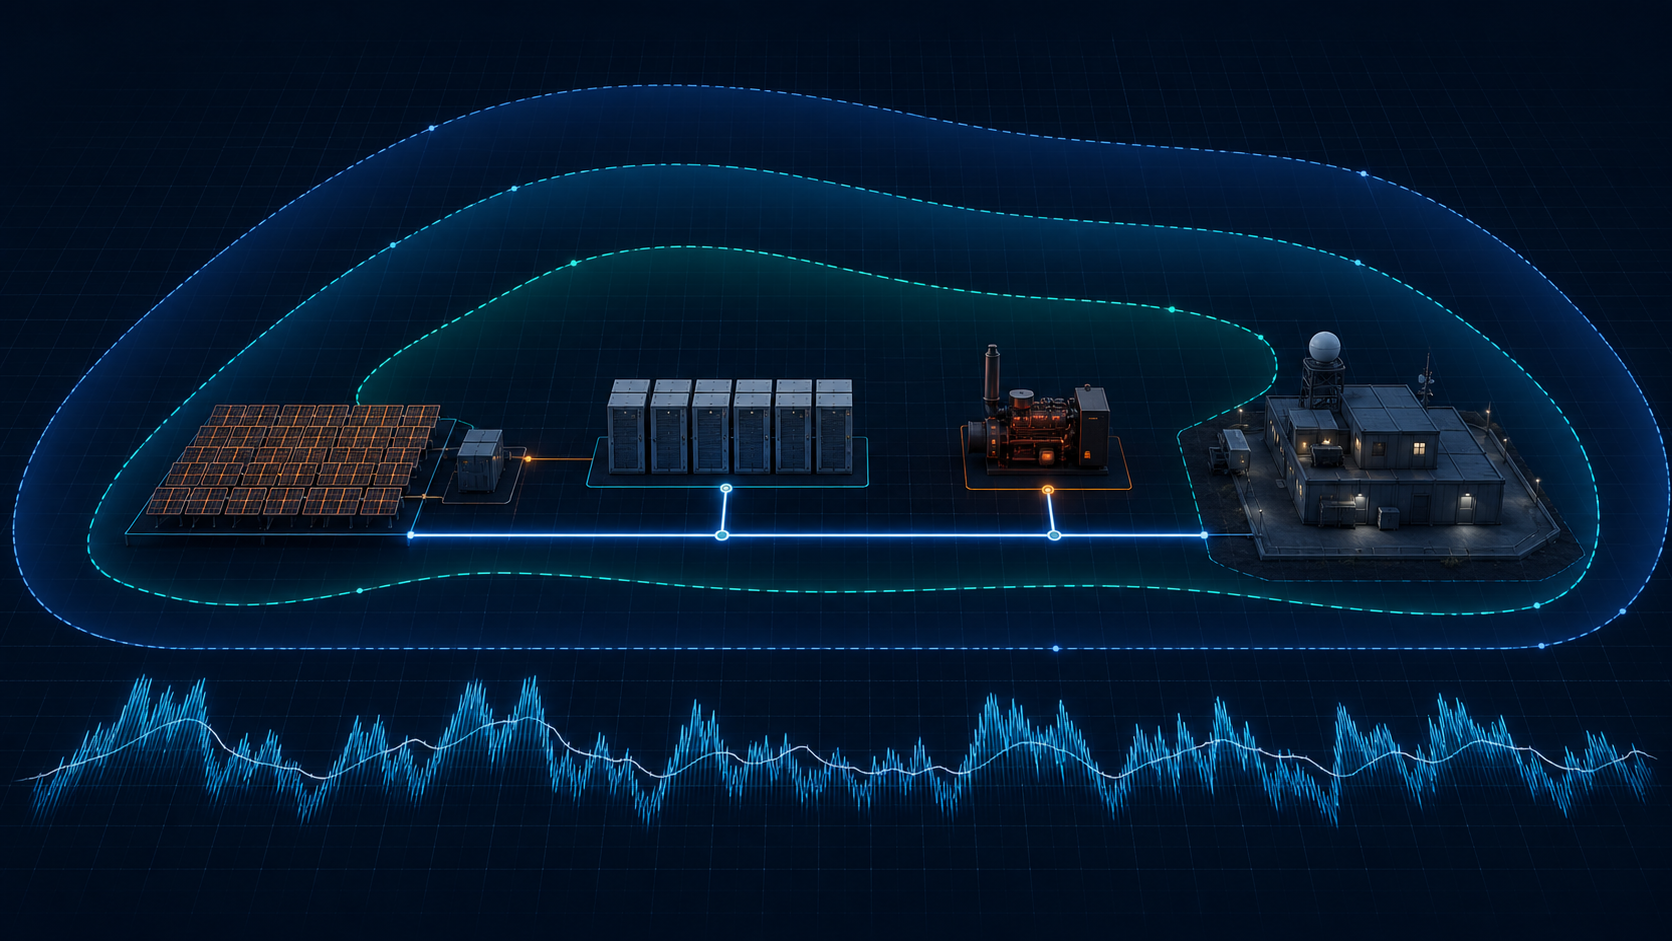
Size an off-grid microgrid by converting a validated 8,760-hour load, chronological solar resource, reliability rule, and lifecycle costs into bounded PV-kW, battery-kW/kWh, and diesel-kW candidates. Dispatch every candidate through every hour, reject designs that break supported load, state-of-charge, power, or reserve rules, then rank the feasible set. The answer changes with load shape, growth, bad-weather years, component limits, fuel price and logistics, and allowed unmet energy.
Key takeaways
- Treat annual energy, peak demand, and autonomy ratios as search anchors, not final equipment sizes; chronology decides when PV, battery, and diesel capacity can actually work together.
- Size battery power and battery energy separately. A kWh value does not prove that the battery or converter can serve the required kW in a difficult hour.
- Reject infeasible candidates before ranking cost. A low NPC or LCOE is irrelevant when the design violates the agreed unmet-load, reserve, state-of-charge, or operating rule.
- Inspect the hard hours behind the selected candidate, then test load, resource, fuel, costs, component availability, and the reliability rule far enough to change the decision.
- Carry a credible capacity range into vendor and electrical review. An hourly single-bus sizing model is not a one-line diagram, power-flow study, controls design, or procurement specification.
What off-grid microgrid sizing should decide
Sizing is the planning job of selecting credible PV power, battery energy and power, converter power, and diesel generation capacity for a defined load and reliability rule. The output should be a preferred screening candidate, nearby alternatives, binding constraints, and the assumptions that would move the choice. It should not be a single unexplained equipment list.
This workflow applies to isolated PV + battery + diesel systems where hourly energy adequacy and lifecycle cost are the immediate questions. It assumes one aggregate electrical bus and an explicit dispatch policy. This worked evidence does not size wind, hydro, or a multiple-generator fleet. Network constraints, protection, transient stability, controls implementation, civil works, permitting, and vendor-specific ratings also remain outside its scope.
Sandia describes conceptual microgrid design as an iterative, roughly 10% to 20% design used to compare options and tradeoffs before full engineering. That is the right boundary here. Use the separate feasibility-study guide to define the approval gate, study scope, report, and handoff; use this page to understand how the capacity candidates are built, rejected, ranked, and audited.
Sources for this section: Sandia Microgrid Conceptual Design Guidebook
Lock the sizing inputs before searching capacities
Capacity results inherit every weakness in the load, resource, component, reliability, and cost inputs. The U.S. Department of Energy identifies site boundaries, time-series demand, renewable-resource data, technology cost, efficiency, size, land, and life as core screening inputs. NLR guidance similarly treats actual interval demand as the most accurate load representation and simulated profiles as a documented fallback.
Record a central value, defensible range, unit, source, date, owner, and confidence level for each material input. If a value is synthetic, scaled, or assumed, say so before the result table rather than hiding it in a footnote.
| Input group | Required basis | Sizing consequence | Preflight check |
|---|---|---|---|
| Load | 8,760 chronological kW values, annual kWh, peak kW, time zone, gaps, critical-load boundary, and growth case | Sets the energy, power, duration, and difficult-hour requirements seen by every component | Reconcile interval sum and maximum with meters, bills, schedules, and known seasonal operations |
| Solar resource | Chronological irradiance or PV production factor, location, year or typical-year method, orientation, temperature, and losses | Controls when PV can serve load or recharge storage, not only annual kWh per kWp | Compare annual specific yield and seasonal shape with an independent source or nearby operating asset |
| Battery and converter | Usable state-of-charge window, charge and discharge kW, kWh, efficiency, degradation, life, and replacement cost | Separates short high-power support from multi-hour energy shifting and lifecycle replacement exposure | Keep nameplate, usable energy, DC/AC boundary, C-rate, and converter efficiency internally consistent |
| Diesel generation and fuel | Derating, minimum loading, fuel curve, O&M, lifetime hours, starts, delivered fuel price, and external fleet or outage requirements | Sets firm power, low-resource coverage, operating reserve, fuel use, and replacement timing | Reconcile modeled loading and fuel rate with vendor data, site conditions, maintenance, and logistics; review fleet and outage rules outside the current automatic search |
| Reliability and dispatch | Maximum unmet energy, renewable and excess-energy rules, reserve treatment, minimum state of charge, operating strategy, and separately documented contingencies | Determines which candidates are feasible before economics are compared | Translate supported rules into exact model metrics; evaluate equipment outages and fuel inventory manually or in a tool that can enforce them |
| Economics and constraints | Project life, discount and inflation convention, capital, installation, O&M, replacements, fuel escalation, land, and applicable incentives | Changes the ranking among technically feasible candidates and may move the search boundary | Keep currency and real or nominal conventions consistent; use ranges rather than an unsupported point estimate |
Sources for this section: DOE distributed energy project identification · NLR load profile input guidance
The 10-step 8,760-hour sizing workflow
The sequence below keeps the optimization tied to the reader job: choose capacities that satisfy the stated service rule, then understand why they were selected. Repeat the loop whenever the inputs, constraints, or vendor boundaries change.
- Define the load and service boundary. State which loads are included, which are critical or flexible, and whether future phases are built into the same profile.
- Validate the 8,760-hour demand. Check units, timestamps, missing and duplicate intervals, annual energy, peak power, load factor, seasonality, and extreme ramps.
- Build the chronological resource cases. Preserve the relationship between solar availability and demand, and include a lower-resource year or sequence when reliability matters.
- Write the reliability and operating rules. Set the current run's unmet-load, renewable-fraction, excess-energy, state-of-charge, and reserve rules before viewing cost; record fuel inventory, equipment outage, and fleet requirements for separate manual or external review.
- Set component and economic assumptions. Separate battery kW from kWh, use consistent AC/DC ratings, and document efficiencies, costs, lives, replacements, and fuel delivery.
- Create a broad search envelope. Use energy, peak, autonomy, and site limits to bound PV, battery energy, battery power, converter, and generator candidates. Compare discrete vendor choices separately when the current browser search cannot encode them.
- Dispatch every candidate chronologically. Carry state of charge from hour to hour and record unmet load, reserve, curtailment, generator loading, fuel, and component utilization.
- Reject infeasible designs before ranking. Only compare lifecycle cost or another objective among candidates that pass every hard rule.
- Refine around the best feasible region and retain alternatives. Search between coarse points, check the boundary, and preserve near-best designs that may fit vendor or site constraints better.
- Audit difficult hours and run decision-changing sensitivities. Inspect the sequences behind binding metrics, vary uncertain inputs, and hand off a capacity range with unresolved risks.
Use simple ratios to build the search envelope—not to choose the answer
Annual load divided by annual PV specific yield is a useful energy anchor. Average critical load multiplied by an autonomy interval is a useful battery-energy anchor. Peak load plus a stated reserve or contingency is a useful firm-power anchor. None of these preserves the hourly order of cloudy periods, night load, battery limits, generator minimum loading, or growth.
For the unscaled synthetic Island guesthouse case below, annual demand is 371,691.5 kWh, peak demand is 80 kW, average demand is 42.43 kW, and the synthetic tropical resource yields 1,194.4 kWh per installed kWp. The annual-energy PV anchor is therefore about 311 kW. The current engine searches on both sides of that anchor and then refines locally rather than declaring 311 kW to be the design. A separate joint-grid audit is still necessary because coordinate refinement can miss interactions among axes.
| Search axis | Coarse values | Why the range exists | Automatic first-pass result |
|---|---|---|---|
| PV power | 0, 98, 200, 290, 390, 490, 590, and 680 kW | Spans zero PV through about 2.2 times the annual-energy anchor so fuel, storage, and curtailment tradeoffs can appear | 440 kW |
| Battery energy | 0, 91, 180, 270, 370, 460, 550, and 640 kWh | Spans zero storage through eight peak-load hours as an initial envelope, then permits local expansion | 641 kWh |
| Battery power | Locally tested as separate power-to-energy ratios | Prevents one fixed C-rate from deciding both short-duration power and longer-duration energy | 128.2 kW |
| Diesel generation | 0, 40, 70, 100, and 150 kW | Tests renewable-plus-storage support against generator capacities below, near, and above the 80 kW peak | 40 kW aggregate genset |
| Converter power | Derived for each PV and battery-power candidate | Keeps conversion capacity consistent with the modeled PV, battery, and load power paths | 396 kW screening value |
Reproduce the worked evidence from exact assumptions
The table below is the input manifest for the published numbers. Engine files were unchanged from Git commit 442176a; the article and image are published later. The benchmark key and numeric assumptions are included so a future reviewer can distinguish this run from changed defaults. Values not listed as decision variables were held constant across all three load-scale searches.
The automatic search uses a complete coarse PV × battery-energy × generator grid, then coordinate refinement over PV, battery energy, battery power, and generator size. The separate base-case audit evaluates the full Cartesian product of the stated nearby values. Neither method proves a continuous global optimum.
| Input block | Exact values used | Reproduction note |
|---|---|---|
| Version and benchmark | Engine logic at Git commit 442176a; benchmark key island-guesthouse; deterministic synthetic hospitality load and tropical resource | Load and resource are generated by the benchmark code, not imported measurements |
| Load cases | 8,760 hourly base values; 371,691.5118 kWh/year; 80 kW peak; multipliers 0.8, 1.0, and 1.2; annual growth 0% | Each multiplier preserves the same hourly shape; every candidate is re-dispatched over 25 project years |
| PV and resource | 1,194.4088 kWh/kWp year-one specific yield; 11° tilt; 180° azimuth; 0.85 derate; -0.0037/°C coefficient; 45°C NOCT; 0.5%/year degradation; 30-year service life | Synthetic resource; no historical bad-weather year or measured availability case was tested |
| Battery and converter | Battery round-trip factor 0.975; minimum/initial state of charge 0.20/0.50; 4,000-cycle life; 15-year calendar life; converter efficiency 0.96 and life 15 years | Battery kWh and kW vary by candidate; current dispatch uses load-following |
| Generator and reserve | One aggregate genset; 15% minimum load; fuel curve 0.08 L/h per rated kW + 0.25 L/kWh; 15,000-hour life; reserve basis 10% of served load + 25% of PV serving load; 2% reserve-shortfall tolerance | No fleet commitment, N+1, minimum runtime, start cost, fuel-inventory cap, or equipment-outage constraint |
| Economics | 25 years; 8% nominal discount; 2% inflation; $1.55/L diesel; 2% real fuel escalation; $5/kWh value of lost load; incentive 0% | Currency is USD; load growth and grid-electricity escalation are inactive in this off-grid case |
| Capital and O&M | PV $900/kW + $12/kW-year; battery $253/kWh + $7/kWh-year; genset $880/kW + $0.02/generated kWh; converter $300/kW + $4/kW-year; fixed BOS $20,000 | Editable screening defaults, not supplier or EPC quotations |
| Hard model rules | Maximum unmet fraction 0; minimum renewable fraction 0; maximum excess fraction 1; feasibility enforced across the project dispatch | Zero modeled unmet energy does not represent equipment outages, subhourly events, or field reliability |
| Base nearby-grid audit | PV [390, 415, 440, 465, 490] kW × battery [550, 600, 641, 680, 720] kWh × genset [40, 50, 60, 70, 80] kW × battery C-rate [0.20, 0.33, 0.50] | 375 explicit candidates evaluated with the same 25-year dispatch and economics; this audit is separate from the browser's automatic search |
Worked sizing run: the synthetic Island guesthouse
We reran the current Island guesthouse benchmark on July 19, 2026. The benchmark is a deterministic synthetic 8,760-hour hospitality load and tropical solar resource, not a measured island project. The base load totals 371,691.5 kWh per year and peaks at 80 kW. The economic case uses $1.55/L delivered diesel, a 25-year project life, 8% nominal discount rate, 2% inflation, current editable component-cost defaults, and no tax credit or other incentive.
The automatic search first returned a feasible 440 kW PV, 641 kWh battery, and 40 kW generator candidate. We did not stop there. The explicit nearby-grid audit in the input manifest found a different feasible point with 9.02% lower NPC: 490 kW PV, 720 kWh / 144 kW battery, and the same 40 kW aggregate generator. That material improvement means the automatic first pass is not the recommendation; the joint search needs to be widened before a preferred range is retained.
| Result group | Observed evidence | Decision consequence |
|---|---|---|
| Automatic first pass | 440 kW PV; 641 kWh / 128.2 kW battery; 40 kW aggregate genset; 396 kW converter screening value | $732,173 capital; $1,556,116 NPC; $0.324/kWh LCOE; feasible under the stated model rules, but not accepted without a joint-axis audit |
| Lowest NPC in 375-point nearby audit | 490 kW PV; 720 kWh / 144 kW battery; 40 kW aggregate genset; 441 kW converter screening value | $810,660 capital; $1,415,758 NPC; $0.295/kWh LCOE; NPC is 9.02% below the automatic first pass |
| Audited-point feasibility | 0 kWh unmet; minimum state of charge 20.010%; reserve shortfall 0.084% within the engine's current 2% tolerance | Passes the supported hard checks, but still needs low-resource, outage, fleet, fuel-logistics, and vendor review outside this automatic search |
| Audited-point first-year operation | 91.30% renewable; 12,152 L fuel; 1,027 generator hours; 146 starts; 256 equivalent battery cycles; 229,249 kWh curtailed | More capital buys less fuel than the first pass; the large surplus still needs land, flexible-load, curtailment, and commercial review |
| Audit conclusion | The first-pass coordinate refinement missed an interaction between higher PV, higher battery energy, and lower battery C-rate inside the published audit grid | Do not label either point a continuous optimum. Expand the joint grid, retain same-input alternatives, and only then map the range to real equipment |
Sensitivity: the same load shape at 80%, 100%, and 120%
To show why capacity cannot be scaled by one universal multiplier, we reran the same hourly guesthouse shape at 80%, 100%, and 120% of its base kW values. Each automatic search rebuilt its envelope, used the same solar series and economics, and required 0% modeled unmet energy. Only the load scale changed.
These are comparable first-pass outputs from the same procedure, not final optima; only the 100% case received the separate 375-point audit above. PV, battery, and generator capacities rise with demand, but not in perfectly equal proportions. Renewable fraction also falls from the 80% case before recovering slightly in the 120% case. The pattern is a signal to audit each joint search, not a fixed sizing law.
| Load case | Annual load and peak | Automatic first-pass capacities | First-year operation | Lifecycle result |
|---|---|---|---|---|
| 80% load | 297,353 kWh; 64 kW peak | 360 kW PV; 575 kWh / 102.6 kW battery; 35 kW genset | 89.72% renewable; 11,714 L fuel; 0 kWh unmet | $617,475 capital; $1,149,684 NPC; $0.299/kWh LCOE |
| 100% load | 371,692 kWh; 80 kW peak | 440 kW PV; 641 kWh / 128.2 kW battery; 40 kW genset | 84.84% renewable; 20,786 L fuel; 0 kWh unmet | $732,173 capital; $1,556,116 NPC; $0.324/kWh LCOE |
| 120% load | 446,030 kWh; 96 kW peak | 545 kW PV; 770 kWh / 154 kW battery; 50 kW genset | 85.00% renewable; 24,772 L fuel; 0 kWh unmet | $896,460 capital; $1,883,942 NPC; $0.327/kWh LCOE |
Size each component for its own binding job
PV, battery energy, battery power, converter power, and diesel generation are coupled, but they are not interchangeable. An extra kWh of storage cannot fix an undersized inverter. A larger generator may cover the peak but increase part-load exposure. More PV can reduce fuel and still create a low-solar sequence that only storage or dispatchable generation can bridge.
NLR describes off-grid reserve as responsive capacity held for unexpected load increases and PV decreases. Its current manual also separates generator size, minimum turndown, replacement, fuel, and reserve inputs. Those distinctions belong in the sizing model even when a first-pass equipment list looks simpler.
| Capacity | Primary sizing job | Binding evidence | Common handoff trap |
|---|---|---|---|
| PV kW | Produce energy in the actual seasonal and hourly resource pattern | Low-resource dispatch, annual yield, land limit, curtailment, and degradation | Sizing from average peak-sun hours alone and ignoring chronology or the AC/DC rating convention |
| Battery kWh | Move renewable energy across multi-hour deficits within the usable state-of-charge window | Lowest-state-of-charge sequences, usable depth, efficiency, degradation, and replacement | Calling nameplate kWh usable autonomy without accounting for limits and losses |
| Battery kW | Serve ramps and peaks and absorb available charging power | Maximum charge and discharge hours, C-rate, temperature, and converter limit | Assuming the selected kWh can deliver any required kW |
| Converter kW | Carry the modeled AC/DC power paths without clipping required service | Coincident PV, battery, and load power plus efficiency and architecture | Treating an aggregate screening value as a vendor-ready inverter schedule |
| Genset kW | Provide firm power and low-resource coverage while holding required reserve | Difficult-hour loading, battery support, derating, unit sizes, redundancy, fuel, and maintenance | Accepting one aggregate rating without testing motor starts, N+1 policy, multiple units, or site derating |
Sources for this section: NLR REopt web tool user manual
Why the modeled generator can be smaller than the peak load
The base screening result selects a 40 kW aggregate generator for an 80 kW peak because the modeled battery and PV can share the load and reserve obligation. That is a legitimate energy-feasibility result under the stated single-bus dispatch assumptions. It is not a general rule that every 80 kW site should buy a 40 kW generator.
A site may require the generator plant to carry the full peak without PV, start motors, recharge the battery while serving load, survive altitude and temperature derating, meet an N+1 policy, or use discrete units with maintenance outages. Treat each applicable rule as an external acceptance criterion, rerun the closest available screen, or use a tool that can enforce it. The current browser optimizer models one aggregate genset; it does not expose fleet commitment, N+1, minimum runtime, start cost, fuel-inventory, equipment-outage, protection, or transient-response constraints.
- Keep a full-peak or N+1 generator case when the operating philosophy requires independent firm capacity.
- Use vendor fuel curves and derated ratings at the actual elevation, temperature, and fuel quality.
- Check starting and step-load requirements outside an hourly energy model, then reconcile the required rating back into dispatch.
- Test fuel storage and delivery interruption manually or in a tool that can enforce inventory constraints, not only through price per liter.
Audit the hard sequence, not just the annual totals
In the audited base point, the battery reaches its minimum modeled state of charge at zero-based dispatch index 3,150—the 3,151st hourly record—while the annual peak load occurs at index 4,507, the 4,508th record. That difference is the point of chronological sizing: the binding energy sequence is not necessarily the peak-power hour. Export the dispatch, inspect the records leading into each constraint, and confirm that the model behavior matches the intended operating policy.
PNNL research on PV resource modeling shows that different treatments of solar conditions can change component and fuel requirements for resilience. A single typical or synthetic year is therefore a screening case, not proof against every weather sequence. Add historical or deliberately adverse resource cases when the consequence of undersizing is high.
- Find the minimum state-of-charge hour and inspect at least the preceding 24 to 72 hours.
- Find the annual peak, largest ramp, lowest solar period, longest generator run, and largest reserve shortfall.
- Reconcile hourly and annual energy balance after conversion losses, curtailment, and unmet load.
- Check generator loading, starts, hours, fuel, and maintenance exposure against the proposed equipment strategy.
- Repeat lower-solar and higher-load cases in the model; evaluate equipment outages, fuel inventory, and other unsupported rules as separate manual or external cases.
Sources for this section: PNNL research on PV resource modeling for microgrid sizing
A practical sizing decision rule
Retain a preferred capacity range only when at least one candidate passes every hard constraint; the difficult-hour dispatch is operationally credible; nearby feasible designs have been reviewed; and the recommendation remains inside the acceptable cost and service range under the agreed load, resource, fuel, component, and reliability sensitivities.
If a small input change moves the preferred size sharply, do not hide the instability behind a rounded recommendation. Collect better data, widen the range, stage the decision, or carry multiple alternatives into the next gate. If the lowest sampled point sits on a search boundary, expand that boundary before accepting it. If vendor, land, or redundancy constraints invalidate the numerical best, rerun with the real feasible set.
| Uncertainty | Minimum rerun | Decision signal |
|---|---|---|
| Load | Corrected central profile plus credible low, high, phased-growth, and critical-load cases | PV, battery, generator, fuel, or service rule changes materially |
| Solar | Alternative weather years or a documented low-resource sequence plus loss and availability cases | Hard hours, storage, generator duty, or unmet load shift |
| Battery | Usable energy, power, efficiency, degradation, cost, calendar life, and replacement timing | Power-to-energy ratio or replacement exposure changes the preferred design |
| Generator and fuel | Screen delivered fuel price and escalation in the current model; review discrete unit sizes, derating, outage, and fuel inventory as external or manual cases | Firm capacity, generator hours, fuel logistics, or lifecycle rank changes |
| Reliability | Use exact supported unmet-load, reserve, and state-of-charge rules; test equipment outages and other unsupported contingencies manually or in a suitable external model | A lower-cost candidate fails the service definition or the preferred case needs more redundancy |
| Economics and site | Installed costs, replacements, project life, discount convention, land, logistics, and contingency | A neighboring candidate or a staged project becomes more practical than the numerical best |
Limitations and engineering handoff
This worked artifact uses synthetic load and solar data, editable generic costs, one aggregate generator, hourly single-bus dispatch, and a deterministic sampled search. It does not test field performance, forecast error, subhourly ramps, motor starting, multiple generator commitment, power flow, fault current, protection, harmonics, stability, controls code, communications, fire safety, civil works, permitting, interconnection, or constructability.
Give the next engineer the 8,760-hour inputs, resource series, assumptions, constraints, search bounds, preferred and alternate capacities, hourly dispatch exports, hard-hour timestamps, sensitivity cases, model version, and unresolved risks. Replace each generic component and cost value with site- and vendor-specific evidence, then rerun after any material equipment or network change.
Bottom line
A defensible off-grid microgrid size is not annual kWh divided by sun hours plus an arbitrary number of battery days. It is a capacity range that serves the chronological load under explicit rules, survives the important sensitivities, exposes the binding hours, and remains understandable to the next reviewer.
Use MicrogridModeler for the focused browser-first PV + battery + diesel sizing and dispatch screen. Keep the feasibility pillar for study scope and approval gates, spreadsheets for input QA and commercial checks, and detailed electrical and vendor workflows for the engineering decisions an hourly energy model cannot make.
Keep exploring
Sources and review notes
This article is grounded in the cited technical sources and the stated modeling assumptions. Recheck project inputs, equipment data, and local requirements before using it for design.
Run the first pass, then widen the audit
Open a benchmark or bring a validated 8,760-hour load, run the automatic capacity search as a first pass, export the dispatch evidence, and review a wider joint-axis candidate set manually or in a suitable external model before retaining a preferred range.